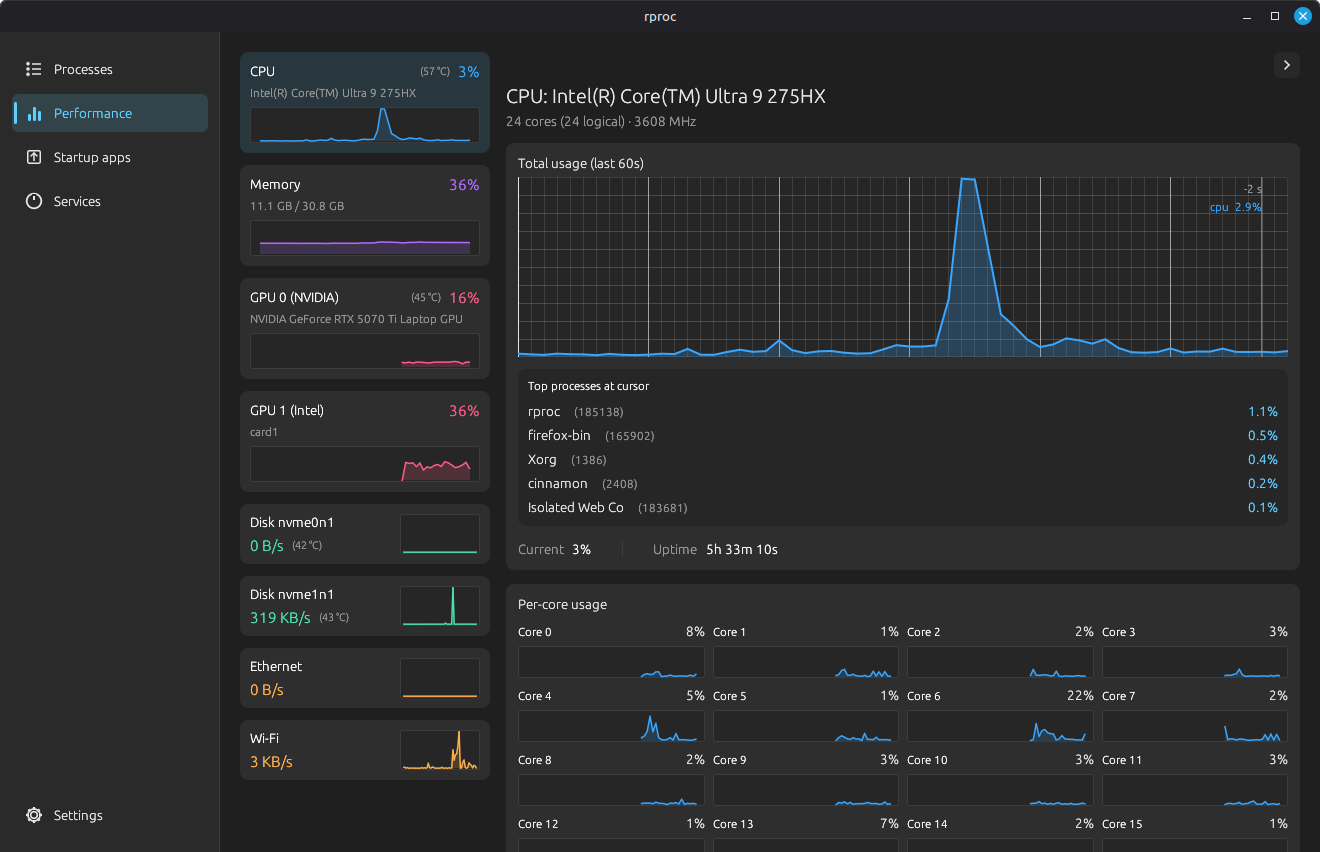
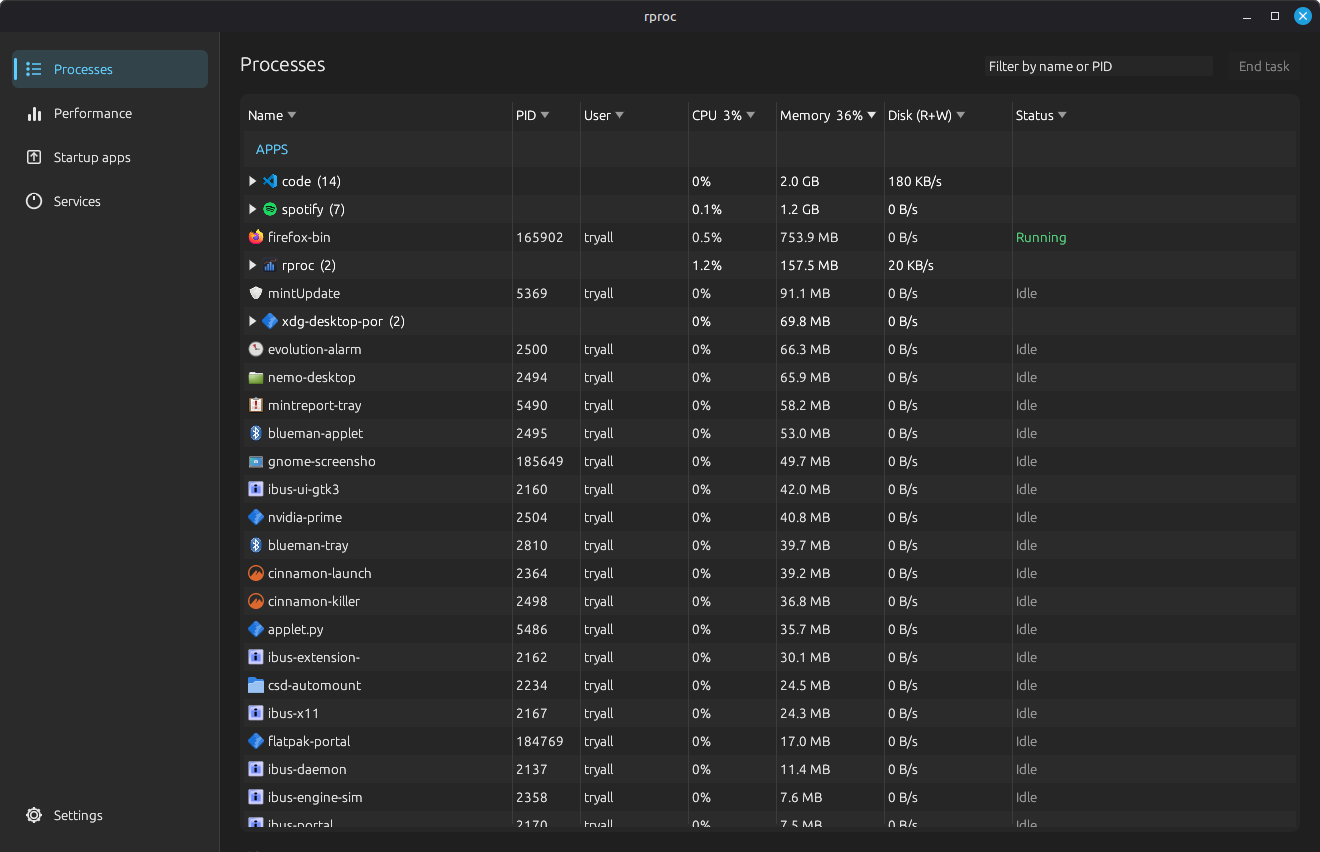
rproc is a Linux resource and process monitor. Think Windows 11’s Task Manager, but native, fast, and open source. It draws live CPU, memory, disk and network graphs, lists every process with its icon, lets you sort and kill them, and surfaces systemd services and startup apps.
A process monitor needs to be tiny. You usually open it precisely when the machine is already struggling under heavy load, so the tool itself has no business adding to the problem.
The first version, written in Rust with egui, already used about 135 MB, lighter than most comparable tools. The rewrite pushed that down to ~30 MB: roughly 4.5× less than my own first version, and up to 87% less than the heaviest mainstream monitor.
| Solution | RAM | vs heaviest |
|---|---|---|
| Mission Center | 239 MB | - |
| Resources | 200 MB | 16% less |
| Gnome System Monitor | 185 MB | 22% less |
| rproc, egui (before) | ~135 MB | 43% less |
| rproc, Slint, GPU off (after) | ~30 MB | 87% less |
The rewrite came down to dropping egui and using Slint instead. But the interesting part isn’t the number. It’s where those 100 MB were hiding, because almost none of it was code I wrote.
Where does a GUI’s memory actually go?
Before optimizing anything, you have to understand what the number even means. The figure a monitor shows for a process is its RSS (Resident Set Size): how much physical RAM the process is using right now. And RSS is not just “the memory your program asked for.” It’s the sum of several things, most of which you never wrote:
- Your own data. The structures your code allocates: rproc’s process list, the little history buffers behind each graph, a few thousand short strings. A couple of MB, realistically.
- All the code you link in. Your program, plus every library it depends on, loaded into memory.
- Libraries pulled in by those libraries. You add one dependency and it quietly drags in ten more. This is where the surprises hide.
- Graphics memory. The moment a program talks to the GPU, the graphics driver maps a pile of its own buffers (and sometimes a slice of video memory) into your process. It all counts as “your” RAM, even though you never asked for a byte of it.
The intuitive assumption (small program, small memory) is simply wrong. What sets your real floor is everything your dependencies drag along with them. rproc’s actual job, reading numbers out of the system, was never the expensive part. Drawing those numbers was.
So the rewrite was never really about writing tighter Rust. It was about choosing dependencies that don’t open expensive doors behind your back.
Why egui was 135 MB: immediate mode and the GPU
egui is a joy to build with. It’s what’s called an immediate-mode GUI, and the idea is simple: there’s no interface you build once and then update. Instead, on every single frame, you re-run your UI code from top to bottom (if button("Kill").clicked()) and the library redraws the whole thing from scratch. It’s the same approach as Dear ImGui in the C++ world, and games love it because it slots straight into a render loop that’s already running 60 times a second.
But “redraw everything, 60 times a second” only makes sense if something very fast is doing the drawing: a graphics card. So egui, through its eframe wrapper, quietly sets up a full GPU pipeline:
- A connection to the graphics driver (in graphics jargon, an OpenGL or wgpu “context”).
- The graphics driver itself, loaded into your program. On NVIDIA’s proprietary driver that’s tens of MB of code and buffers, and once the connection is open you can’t really opt out of it.
- A texture atlas: egui pre-renders every letter of every font, plus your icons, into one big image on the GPU so the card can stamp them onto the screen. Handy, but it costs memory.
None of this is wasteful for what egui is built to do. It’s exactly right for drawing a UI on top of a 3D game at 60 fps. It’s just wildly oversized for a window that updates its numbers once a second and otherwise sits still. I was paying for a real-time game renderer to display text that barely changes.
That’s the lesson hiding in those 135 MB: the weight wasn’t egui’s own code, it was the GPU machinery egui takes for granted. A process monitor needs none of it. It needs to draw some text, some boxes and a few line charts, every now and then.
Retained mode, and the software renderer
Slint flips both of those choices.
First, it’s retained-mode, the opposite of immediate-mode. You describe your interface once, in .slint files (a small, declarative language, a bit like HTML/CSS), and Slint keeps that description in memory. When a value changes, it redraws only the parts tied to that value. When nothing changes, it does nothing at all. For an app that mostly sits there showing numbers, that matches reality far better than “redraw the whole window, constantly.”
Second, and this is where the memory actually disappeared, Slint can draw the entire UI without a GPU at all, using what’s called a software renderer: it paints the pixels with the CPU, straight into a plain block of memory, then hands that finished image to the system to put on screen. No driver connection, no graphics driver loaded into your program, no texture atlas. The whole GPU pile from the previous section simply never exists.
This one change, dropping the GPU renderer, is the biggest single win in the project. egui couldn’t offer it: take the GPU away and it has nothing left to draw with. Slint paints the same window on the CPU and never opens that whole stack, which accounts for most of the gap between 135 MB and the new baseline. (The smaller savings, the icon shrinking, the optional GPU monitoring, and so on, come later.)
And that’s the counter-intuitive headline of the rewrite: for a plain 2D desktop app, not using the GPU is the optimization. We’ve all been trained to think “GPU equals fast equals good.” For a game, sure. For a window full of text and a few charts, the GPU is a tax of tens of MB to make something that was already instant slightly more instant, and you pay for it in memory and in slower startup.
The catch: drawing the live graphs
Dropping the GPU isn’t free. A software renderer is deliberately limited (that’s part of how it stays small and portable), and the live graphs were where that bit hardest.
On a GPU toolkit you’d draw a line chart by building a little text description of the shape at runtime, something like "M 0 0 L 1 5 L 2 3 …" (the same syntax SVG uses), and rebuilding it every time new data arrives. Slint’s software renderer won’t accept a shape assembled on the fly like that, and it won’t let you loop to generate one either: it wants the structure of the shape known up front, when the app is compiled.
So I turned it around. Each graph is a fixed line of 60 points, written out once in the .slint file, where only the position of each point is wired to live data. Rust keeps the last 60 measurements; when a new one arrives the oldest falls off and the points shift along; Slint just moves the existing line segments to their new spots. A little layout glue lets the whole thing stretch to fill whatever space it’s given.
// 60 statically-declared points; coordinates bound to the model.
// No runtime-built command string, no `for` inside the Path.
Path {
    viewbox-width: root.width / 1px;
    viewbox-height: root.height / 1px;
    MoveTo { x: 0;            y: root.pts[0]; }
    LineTo { x: root.step*1;  y: root.pts[1]; }
    LineTo { x: root.step*2;  y: root.pts[2]; }
    // … 57 more, generated once at build time …
}
It’s less elegant than handing over a string, but it’s predictable: always 60 segments, no memory churned on every redraw, and the renderer knows the shape ahead of time. The limitation pushed me toward a cleaner design than I’d have bothered with if the easy path had been available.
The bug that only a refresh tick can cause
Here’s a bug that’s a pure consequence of how the app refreshes. rproc reloads its data on a timer, a few times a second. The tempting thing to do is rebuild the whole process list from scratch each time. Do that, and you create a race that’s almost impossible to reproduce on purpose: a mouse click is really two events, a press and then a release. If a refresh happens to land between them and rebuilds the list, the row you pressed no longer exists by the time you release, so the click just vanishes. Every few seconds, a click silently does nothing.
The fix is to stop rebuilding the list wholesale. Instead the list stays put and its rows are updated in place, edited rather than recreated, so whatever is under your cursor survives a refresh that lands mid-click. It’s the kind of bug that never shows up in a screenshot or a quick demo. It shows up as a vague “clicks sometimes don’t work,” and the only way to kill it is to reason about the order things happen in, not to poke at the UI until it looks fine.
The other 100 MB: things you load whether you use them or not
Swapping the renderer was the big win, but a real chunk came from simply not loading things unless they’re needed. It’s the same idea every time: the cheapest memory is a library you never load at all.
- GPU monitoring is a toggle, not a given. Reading NVIDIA stats means loading NVIDIA’s own libraries, about 20 MB on their own. The old build loaded them no matter what. Now it’s a single setting: turn GPU monitoring off and those libraries are never loaded at all. No GPU graphs, no 20 MB. That toggle is exactly the gap between rproc’s ~50 MB and ~30 MB.
- The optional background service is off by default. rproc can keep recording history even while its window is closed, but that service also pulled in those NVIDIA libraries, another ~25 MB. Off unless you actually want it.
- App icons are shrunk before they’re stored. Process icons come from the system theme at full size and used to be cached as-is. Now each one is shrunk to roughly the size it’s actually shown at (~20 px) before being kept. A list of 300 processes no longer holds 300 full-size images.
- Handing freed memory back to the OS. By default the memory system keeps memory you’ve freed lying around, in case you need it again soon. Great for raw speed, bad for a monitor that should get smaller when idle. So on every refresh rproc explicitly returns that unused memory to the operating system, and the number it reports reflects what’s really in use.
- Trimming dependencies of dependencies. One library rproc uses to draw its SVG icons was, by default, also dragging in an entire text-and-font system it didn’t need (the icons are shapes, not text). Turning that option off removed all of it. And one of Slint’s own dependencies needed a system font library installed, which broke the build server until I added it, exactly the kind of surprise that “libraries pulling in libraries” loves to spring on you.
Each of these is small on its own. Stacked together they’re the gap between “a bit smaller” and “4.5× smaller,” and they’re all the same move: don’t set up what the user hasn’t asked for.
Doing the rewrite with Claude Code
A UI rewrite is the kind of task that’s 80% mechanical and 20% genuinely tricky, which is exactly the shape AI is good at, if you keep it on the right side of that line.
The mechanical 80%: translating six tabs of egui drawing code into .slint declarative views plus Rust glue that maps a Snapshot into Slint models. That’s a lot of typing, a lot of “do the same transformation 47 times,” and a lot of looking up Slint’s syntax. The PR is +7,122 / -3,755 across 47 files; I did not want to hand-write all of it, and I didn’t.
What stayed firmly my job was the architecture and the gnarly 20%: the decision to go software-renderer in the first place, the fixed-60-point graph design, spotting the click-straddles-refresh race, deciding which libraries become opt-out toggles. Those are judgment calls that depend on understanding why the memory was where it was. The model is fast at “make this compile and look right”; it is not the one who should be deciding your memory architecture.
The Rust GUI ecosystem, briefly
If you’re choosing a Rust GUI toolkit, the memory story above is really a story about which trade-off each one makes. The short map:
- egui (immediate mode). Easiest to start with, GPU-first, redraws everything. Brilliant for dev tools, debug overlays and game UIs. The GPU machinery is the price, and you can’t opt out.
- Slint (retained mode, multiple renderers). Declarative
.slintfiles and, the part that mattered here, a real software renderer so you can run with no GPU at all. Designed with phones, embedded screens and low-memory devices in mind, which is exactly why it had the switch I needed. - iced (retained mode). A clean, predictable architecture (modeled on the Elm language). Lovely to work with; still draws on the GPU.
- gtk-rs (the Rust binding to GTK). Mature, native, blends right into the Linux desktop, but you pull in the whole GTK runtime, which is a large baseline of its own.
- Tauri / Dioxus-web (the webview route). Ship a web frontend inside the system’s built-in browser view. Great developer experience, but a webview is essentially a browser engine, and its baseline RAM dwarfs everything above.
There’s no single “best” here. There’s only “best for a thing that has to be lighter than the processes it watches.” For that one constraint, a retained-mode toolkit with an honest software renderer wins, and that’s a much narrower claim than “Slint beats egui.” egui was the right call to get rproc working. It was the wrong call to make it small.
Takeaways
- Measure the floor, not just your code. The memory my own code used was never the problem. What your dependencies quietly drag in, and the systems they switch on, set your real minimum.
- The GPU is a feature, not a default. For a 2D, mostly-idle desktop app, drawing on the CPU instead can be a 4.5× memory win. “GPU-accelerated” is a cost as much as a capability.
- Make heavy things opt-in. A graphics driver, vendor GPU libraries, a background service: anything that costs tens of MB should stay off until the user actually asks for it.
- How a toolkit redraws is a memory decision, not just a style one. “Redraw everything every frame” quietly signs you up for a permanent GPU pipeline; “redraw only what changed” doesn’t.
- AI handles the mechanical 80% and leaves the hard 20% to you. The rewrite was fast because Claude Code did the translation; it was correct because the architecture calls stayed human. And “looks done in a screenshot” is not the same as done.
The final figure: ~30 MB with the GPU off, ~50 MB with it on, against 185 to 239 MB for the popular alternatives. rproc is no longer anywhere near the top of its own process list, which, for a process monitor, was the only acceptable outcome.
Comments
Comments are not configured yet.